Abstract
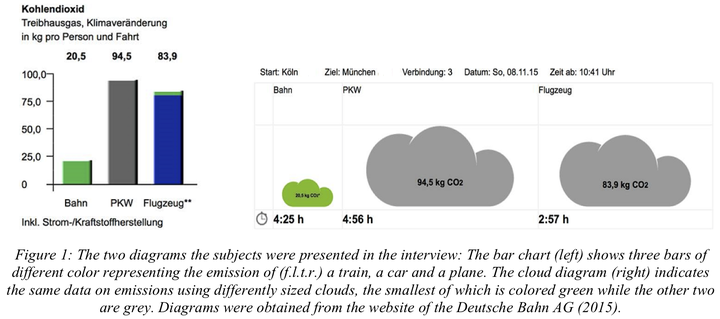
In the face of global warming, CO2 emissions have to be reduced. Everybody can contribute by making CO2 aware decisions. But what decisions are good? Next to texts and figures, visualizations are an important communicative tool to encapsulate information in a way that is understood quickly and po- tentially changes consumer behavior. To have an impact, they have to evoke the trust of the recipient. In this qualitative study we address the mostly neglected topic of how individuals come to trust visuali- zations. We conducted interviews with eight subjects to compare trustworthiness of two visualizations of CO2 emissions of different means of transportation. Either using a bar chart or a chart that depicts differently sized clouds. We analyzed the answers by categorizing different criteria. Overall, the bar chart was considered trustworthier. We argue that trustworthiness of visualizations follows a complex process, which considers different criteria that interact with each other. The criteria with the most influence trustworthiness are: completeness of information, necessity of information, neutrality, reading accuracy and plainness of the graph. Lastly, trust might follow a U-shaped curve when plotted over the density of graph-features.